

The following section covers the main components of the Fluid Explorer plugin. Section 1 discusses the user interface of the beginner’s mode (creating and loading simulations) and Section 2 covers the layout and the components of the interactive exploration and visualization system (advanced mode).
In the following section the interface of the beginner's mode is discussed. After calling the Fluid Explorer plugin, the beginner's mode allows you to create a new simulation or load an existing simulation from your file system.
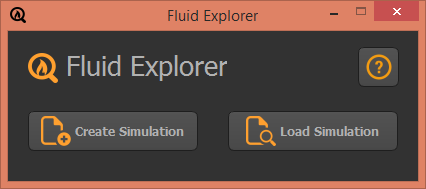
Create Simulation
Stores a new simulation on your file system. A simulation contains meta-information about the project and multiple sequences, where each sequence contains a cached fluid object and rendered animations.
Load Simulation
Allows you to load a simulation from your file system.
Shows the dialog to create a new simulation. Please be sure that the currently opened scene contains a fluid container. The pluign automatically stores a copy of the scene file (fluid_simulation_scene.mb) in the project roots folder of the simulation.
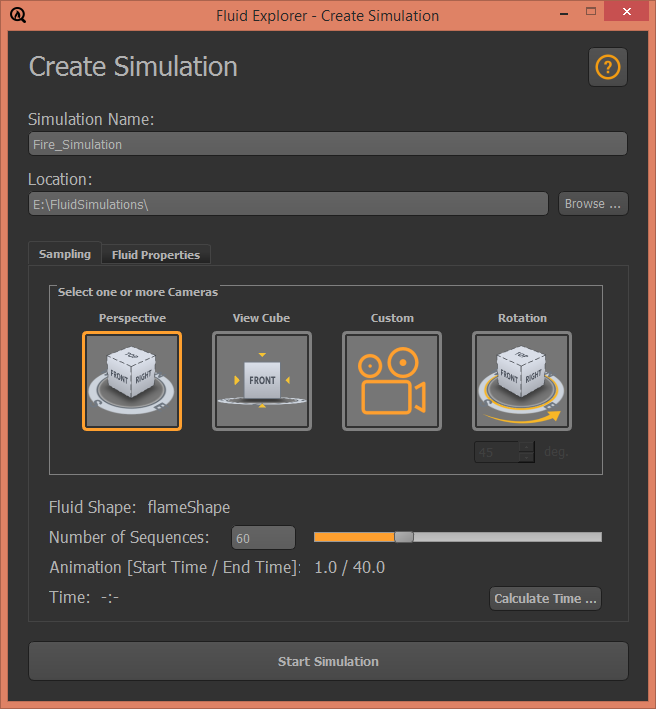
Simulation Name
Specifies the name of the project. The plugin creates a project folder and a project file (ProjectName.fxp) with the specified project name on your file system.
Location
Path on the file system where the project folder is stored.
Sampling
Allows you to select one or multiple cameras which are used for rendering images of the animation during the sampling process.
Fluid Shape
Name of the selected fluid container in the scene file (node type: fluidShape).
Number of Simulations
Specifies the number of sequences which are created.
Animation (Start Time / End Time)
Specifies the animation range start and end times. The values are taken from Maya's timeline view - input fields (start time, end time).
Time
Calculated time for creating the entire simulation.
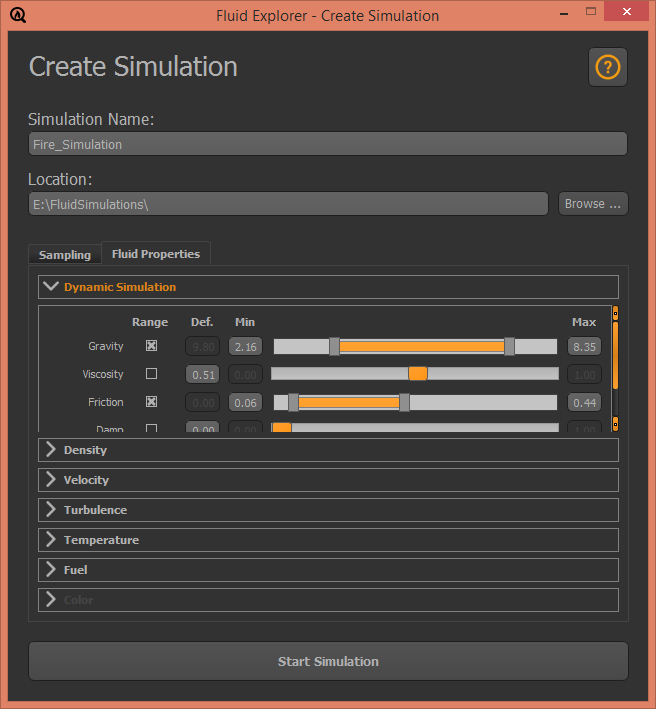
Fluid Properties
Allows you to choose between two modes – single value or range. Please note that you cannot change the value of a locked attribute.
Shows the dialog for loading a simulation. You can load an existing simulatoin by navigating to the project file of the simulation (<ProjectName.fxp>). Please be sure that the correct scene (fluid_simulation_scene.mb) is opened. By default the fluid container is locked (please visit the Maya API for more details about locked nodes).
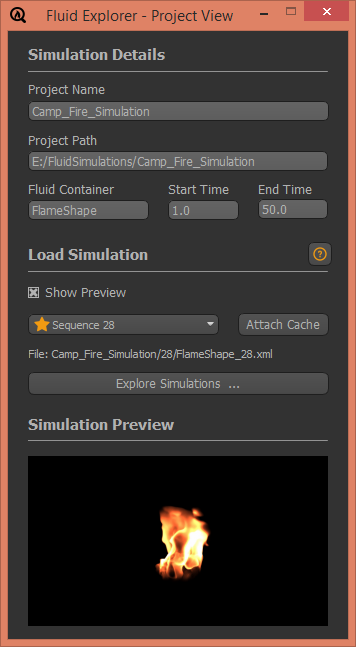
Allows you to load an existing cache or inspect the simuation in the interactive exploration tool.
List of all created sequences. The  icon indicates bookmarked sequences.
Attaches an existing cache file to the current fluid effect object. Alternatively, you can load the cached files manually. Therefore, please navigate to Fluid nCache > Attach Existing Cache File and browse to the desired XML file in the project folder. (Please visit the Maya user guide for more information.)
Opens the exploration and visualization application. Please visit Section 2 - Advanced Mode if you want to learn more about the interactive exploration tool.
Shows a rendered video of the currently selected sequence.
The following section covers the layout of the interactive exploration tool which consists of several different linked views. A more detailed description can be found in the official TVCG publication. Please note that it takes some minutes after you called the exploration tool for the first time on a project. The reason for this delay is the calculation of the sequences and clusters.
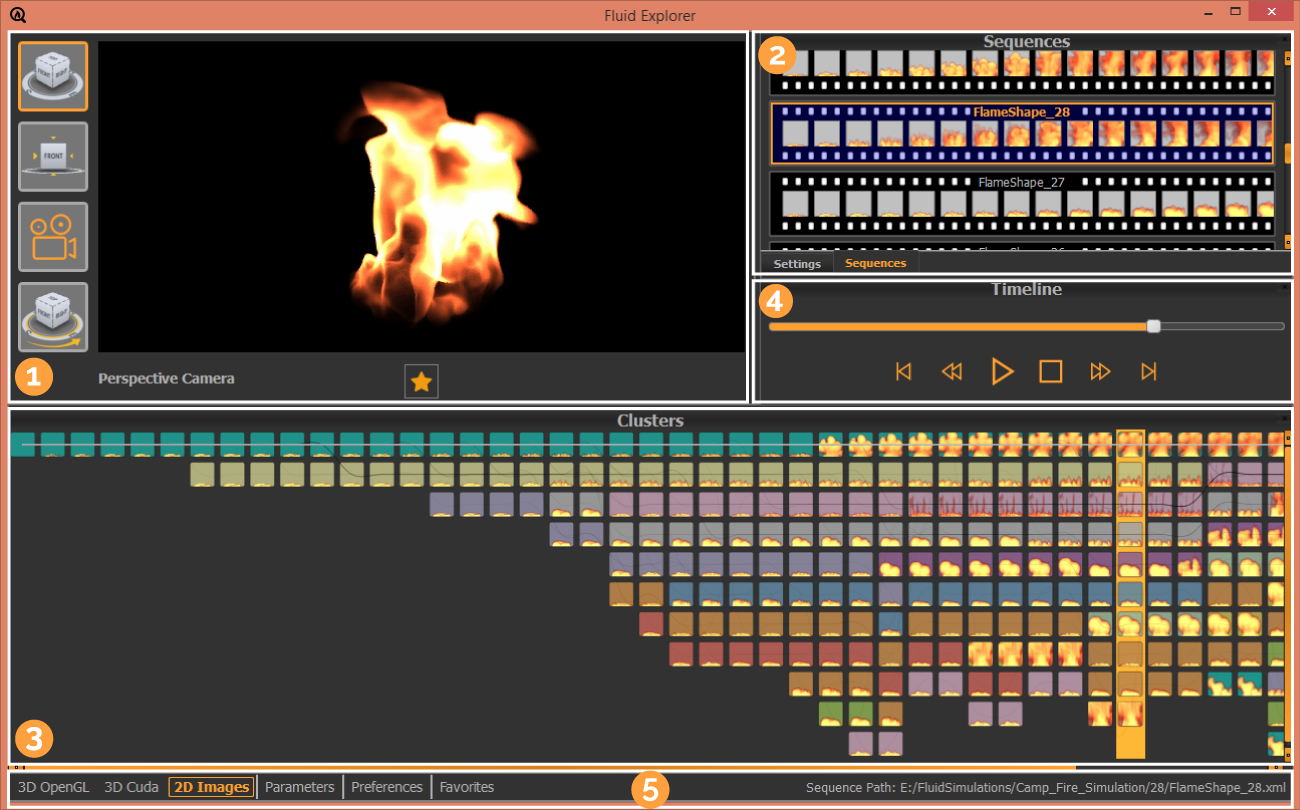
The general layout of the interactive exploration tool is shown in Figure 5 and consists of the following views:
 Animation View
The animation view shows either a 3D volume rendering or a rendered animations (2D images) of the currently selected sequence. The view is controlled by a standard time slider.
 Sequence View / Settings
The sequence view allows you to browse through all available simulation sequences. In addition, this view contains the settings widget which is used to specify the color and the opacity of the volume rendering.
 Cluster Timeline
The cluster timeline is the main element of the application. It gives an overview of the visual variations across the simulated sequences (over their temporal range) and allows to search for sequences with particular characteristics.
 Timeline
The timeline allows you to control the playback of the currently selected sequence by providing a time slider and standard video controls.
 Navigation Toolbar
The navigation toolbar allows you to choose a specific rendering mode (3D volume or 2D images) as well as to visualize the parameter space variation (parameter view) of the currently selected sequence. Furthermore, the toolbar is used to control the parameters of the clustering and to list all bookmarked sequences.
The animation view despicts a visual preview of the currently selected sequence. The application features two different render modes - 3D volumes and 2D images. A standard time slider is provided in order to navigate through the sequences.
The 3D rendering mode shows a volume rendering of the currently selected sequence. You can choose between the two different renderers - OpenGL and CUDA.
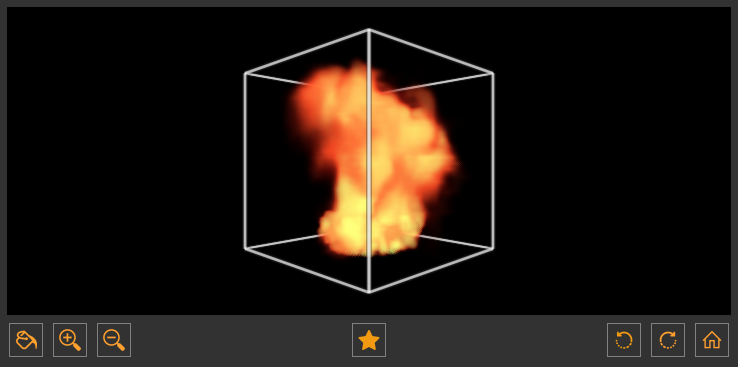
 Change background
 Zoom in
 Zoom out
Bookmark sequences
 Rotate right 45°
 Rotate left 45°
 Home view
Furthermore, the application provides mouse and keyboard mappings in order to interact with the view:
| Interaction | Mouse | Keyboard |
|---|---|---|
| Change viewpoint |  Left mouse button + moving Left mouse button + moving |
Arrows (left, right, down, up) |
| Zoom in / out |  Right mouse button + moving Right mouse button + moving |
Minus Key / Plus Key |
| Move preview box |  Middle mouse button + moving Middle mouse button + moving |
-- |
| Change background | -- | CRTL + B |
| Add / remove bookmark | -- | CRTL + D |
| Home view | -- | CRTL + H |
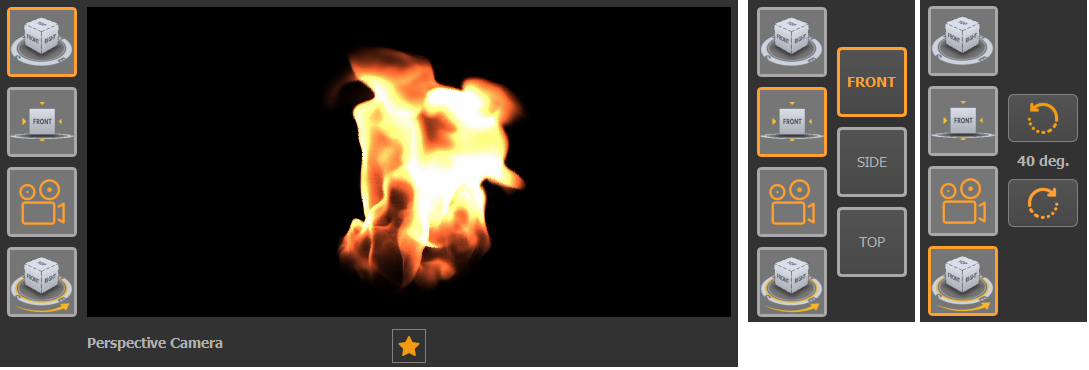
The 2D image mode shows a rendered video of the currently selected sequence. You can choose between the different camera viewpoints - perspective camera, view cub camera, custom camera and rotating camera - which were selected during the creation of the simulation.
This view contains two components - the sequence view and the settings view.
The sequence view provides a simple overview of all simulated sequences by depicting a preview (“film strip”) of their time steps. This view is linked to the other views, so whenever the current sequence gets changed, the new sequence is highlighted in the widget.
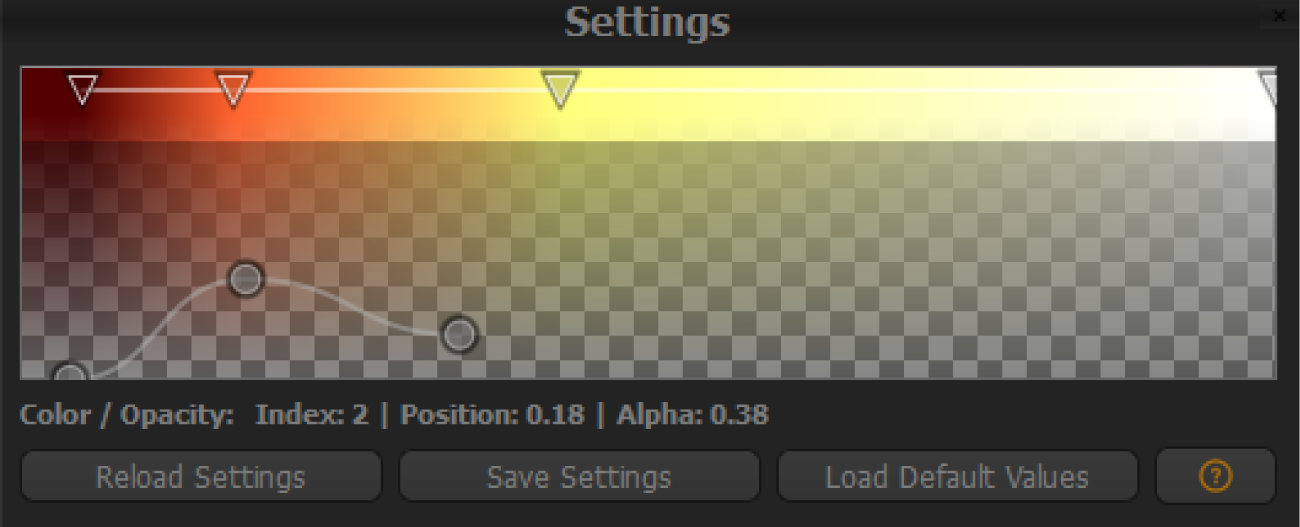
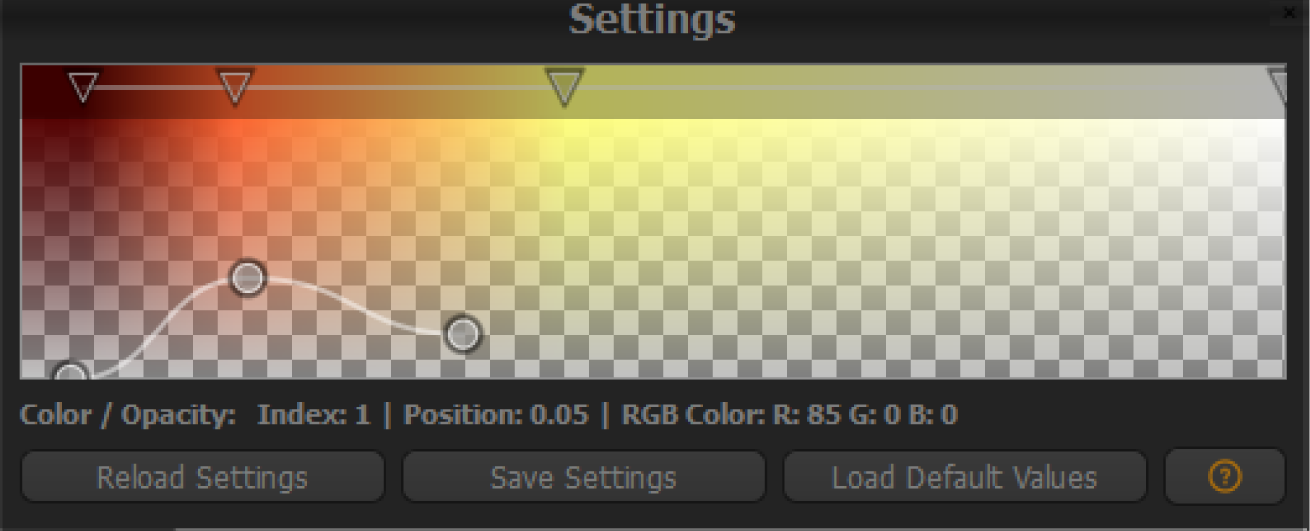
The settings view allows you to create a color and an opacity lookup table for the 3D volume rendering. The color lookup table is defined by a color gradient and the opacity lookupt table is controlled by a cubic spline curve.
In order to define the color for the volume rendering, you can create a color gradient. The color gradient defines a range of color values used to render the fluid. Therefore, you can place color triangles in the upper part of the gradient widget. Each triangle is defined with a color value (RGB) and a horizontal component from 0 and 1. If you place multiple triangles into the widget, a color gradient gets calculated by linearly interpolating the color values of the triangles. You can change the behaviour of the gradient by dragging the triangles. The voxels are mapped into the defined color gradient.
The color gradient widget supports the following user interactions:
| Interaction | Mouse |
|---|---|
| Add color triangle | Right mouse button (empty spot) |
| Remove color triangle | Right mouse button (on an existing triangle) |
| Change the position of a color triangle | Left mouse button + moving |
| Define the color of a color triangle | Left mouse button (double-click) |
The opacity lookup table is controlled by a cubic spline. You can define the curve by placing control points into the opacity widget. The opacity curve defines a range of opacity values used to render the fluid. The vertical component of the opacity widget defines the opacity values from 0 (fully transparant) to 1 (completely opaque). The horizontal component represents the opacity input values from 0 to 1. You can change the behaviour of the curve by dragging the points.
The opacity widget supports the following user interactions:
| Interaction | Mouse |
|---|---|
| Add control point | Right mouse button (empty spot) |
| Remove control point | Right mouse button (on an existing triangle) |
| Change the position of a control point | Left mouse button + moving |
The Fluid Explorer splits each sequence of the entire simulation into multiple segments. These segments are than grouped together (into clusters) by applying a clustering technique. The cluster timeline shows a temporal distribution of the clusters over the duration of the simulation.
Cluster Item
Each cluster in the view is assigned to one color (maximum number of colors is 12) whereby each cluster item represents a subset of the cluster’s members.
Sequence Path
The application generates a sequence path for each sequence of the simulation. This path depicts the progression of cluster memberships of a specific sequence over time and is displayed as a cubic spline. The path of the currently selected sequence is highlighted (light gray) and therefore drawn with full opacity on top of all the other sequence paths (see Figure 10).
Interval Slider
In order to change the compression level of the timeline, you can use a standard slider which appears after moving the mouse cursor into the left part of the cluster timeline view.
Search-By-Example
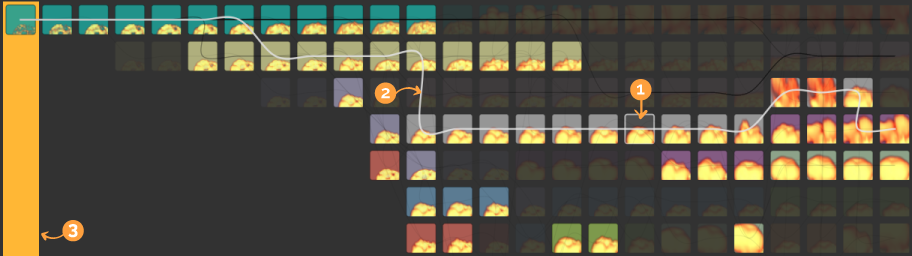
In order to perform a result-driven exploration, you can interact with the timeline view. After selecting a cluster item, all cluster items which have common members are highlighted. This means that a sequence exists which contains both cluster items – the currently selected and one of the remaining items. Furthermore, you can select multiple cluster items in order to further filter the view. After filtering the view, the sequence with the best match regarding the search query is displayed in the animation and sequence view.
Figure 10 shows an example for the interaction with the cluster timeline after one item has been selected (). A cubic spline () connects all cluster members of the currently selected sequence. The cluster items which share no connection with the selection are dimmed.
The remaining cluster items indicate possible variations which share a similar end state regarding the current selection. The orange rectangle () indicates the current position of the Fluid Explorer time slider (position in time).
The cluster timeline items support the following user interactions:
| Interaction | Mouse |
|---|---|
| Select one cluster item in order to filter the view | Left mouse button |
| Select multiple cluster items in order to (further) filter the view | CTRL + Left mouse button |
| Jump to the start position of the respective cluster item | Left mouse button (double-click) |
| Explore the variations within a cluster (show nearest neighbors) | Right mouse button |
| Change the temporal compression level / interval size |  Move mouse cursor to the most left part of the view Move mouse cursor to the most left part of the view |
The timeline allows you to control the playback of the currently selected sequence by providing a time slider and standard video controls.
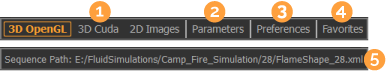
The navigation toolbar provides the following actions:
Change render mode
Allows you to switch between the 2D image mode and the 3D volume rendering mode (OpenGL / CUDA).
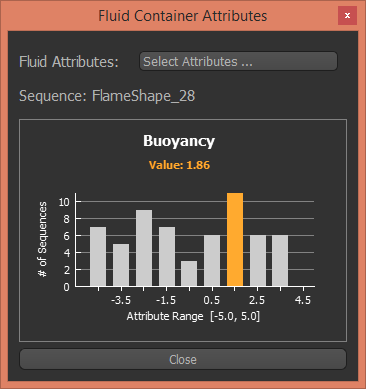
Show fluid parameters
Display multiple bar charts which show the fluid parameter variations and highlight the fluid parameter of the currently selected sequence.
Change preferences
Allows you to change the parameters of the density-based clustering algorithm (DBSCAN). First, the Fluid Explorer application splits each sequence into multiple segments. Secondly, the DBSCAN algorithm is applied in order to group these segments. (For more details please visit Section 4.3 of the Fluid Explorer publication.)
Show favorites
Shows a list of all bookmarked sequences.
Sequence path
Shows the full path to the currently selected sequences.